

Real-Time Analytics & Insights
Supercharge Your Business with the Power of Data and Insights
Modern businesses thrive in an AI-driven era where real-time data analytics and business insights fuel growth. To scale and boost your bottom line, timely, accurate analytics are essential. Strong data management, analytics, and visual storytelling enable informed decisions. Make data-backed decisions confidently. Take your business to the next level with our advanced data platform.

• Are delayed insights from outdated systems slowing your decision-making?
• Do data silos, duplication, and inconsistencies create inefficiencies across teams?
• Are compliance risks and regulatory challenges becoming a growing concern?
If yes, it’s time to rethink your data and insights strategy. With RAIN, you can unify your business analytics approach, eliminate inefficiencies, and ensure regulatory compliance through one seamless platform. Let’s partner to transform your raw data into a strategic advantage using one of the best modern real time data analytics tools for enterprises!


Seamlessly collect data from multiple sources across departments. Combine, group, and logically pre-aggregate your information to deliver insightful business and data analytics, empowering organizations to make smarter, faster decisions.

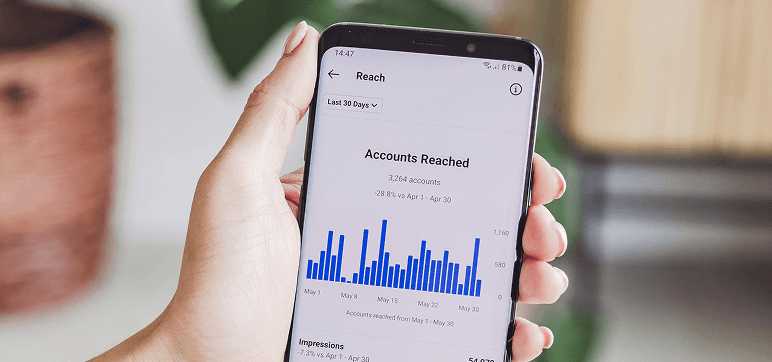
In a mobile-first world, gain access to real-time data analytics via responsive web dashboards and native mobile apps. Stay connected to your business insights anytime, anywhere—on the move.

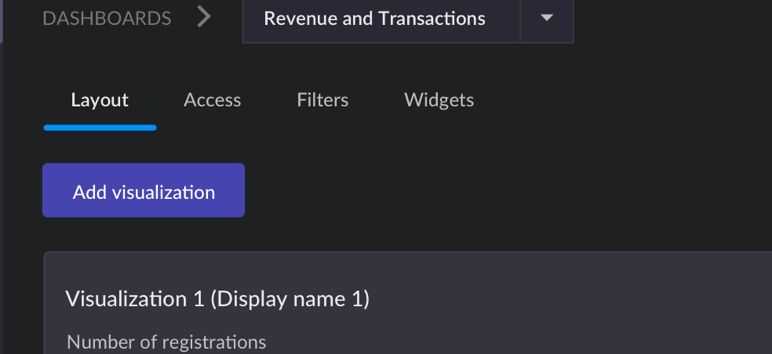
RAIN is built to be personalized. Easily customize dashboards and reports to match your specific business objectives. Whether in retail analytics, manufacturing, or governance, enjoy seamless native integration that improves usability and drives outcomes.
RAIN works by aggregating data from diverse sources and delivering role-based data visualizations on both mobile and web platforms. Through an AI-enhanced engine and intelligent pipeline, RAIN supports decision-makers with a comprehensive analytics dashboard built for today’s modern enterprises.


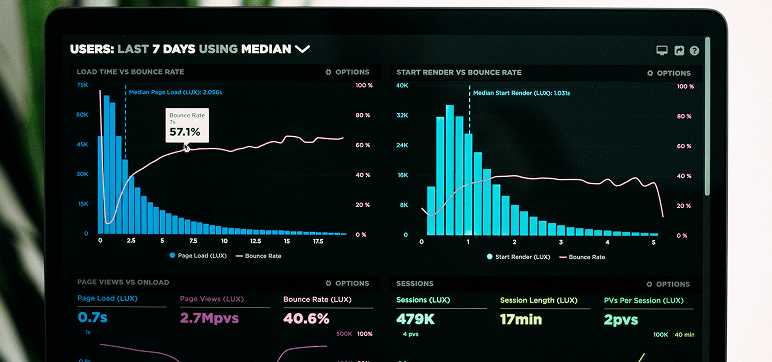
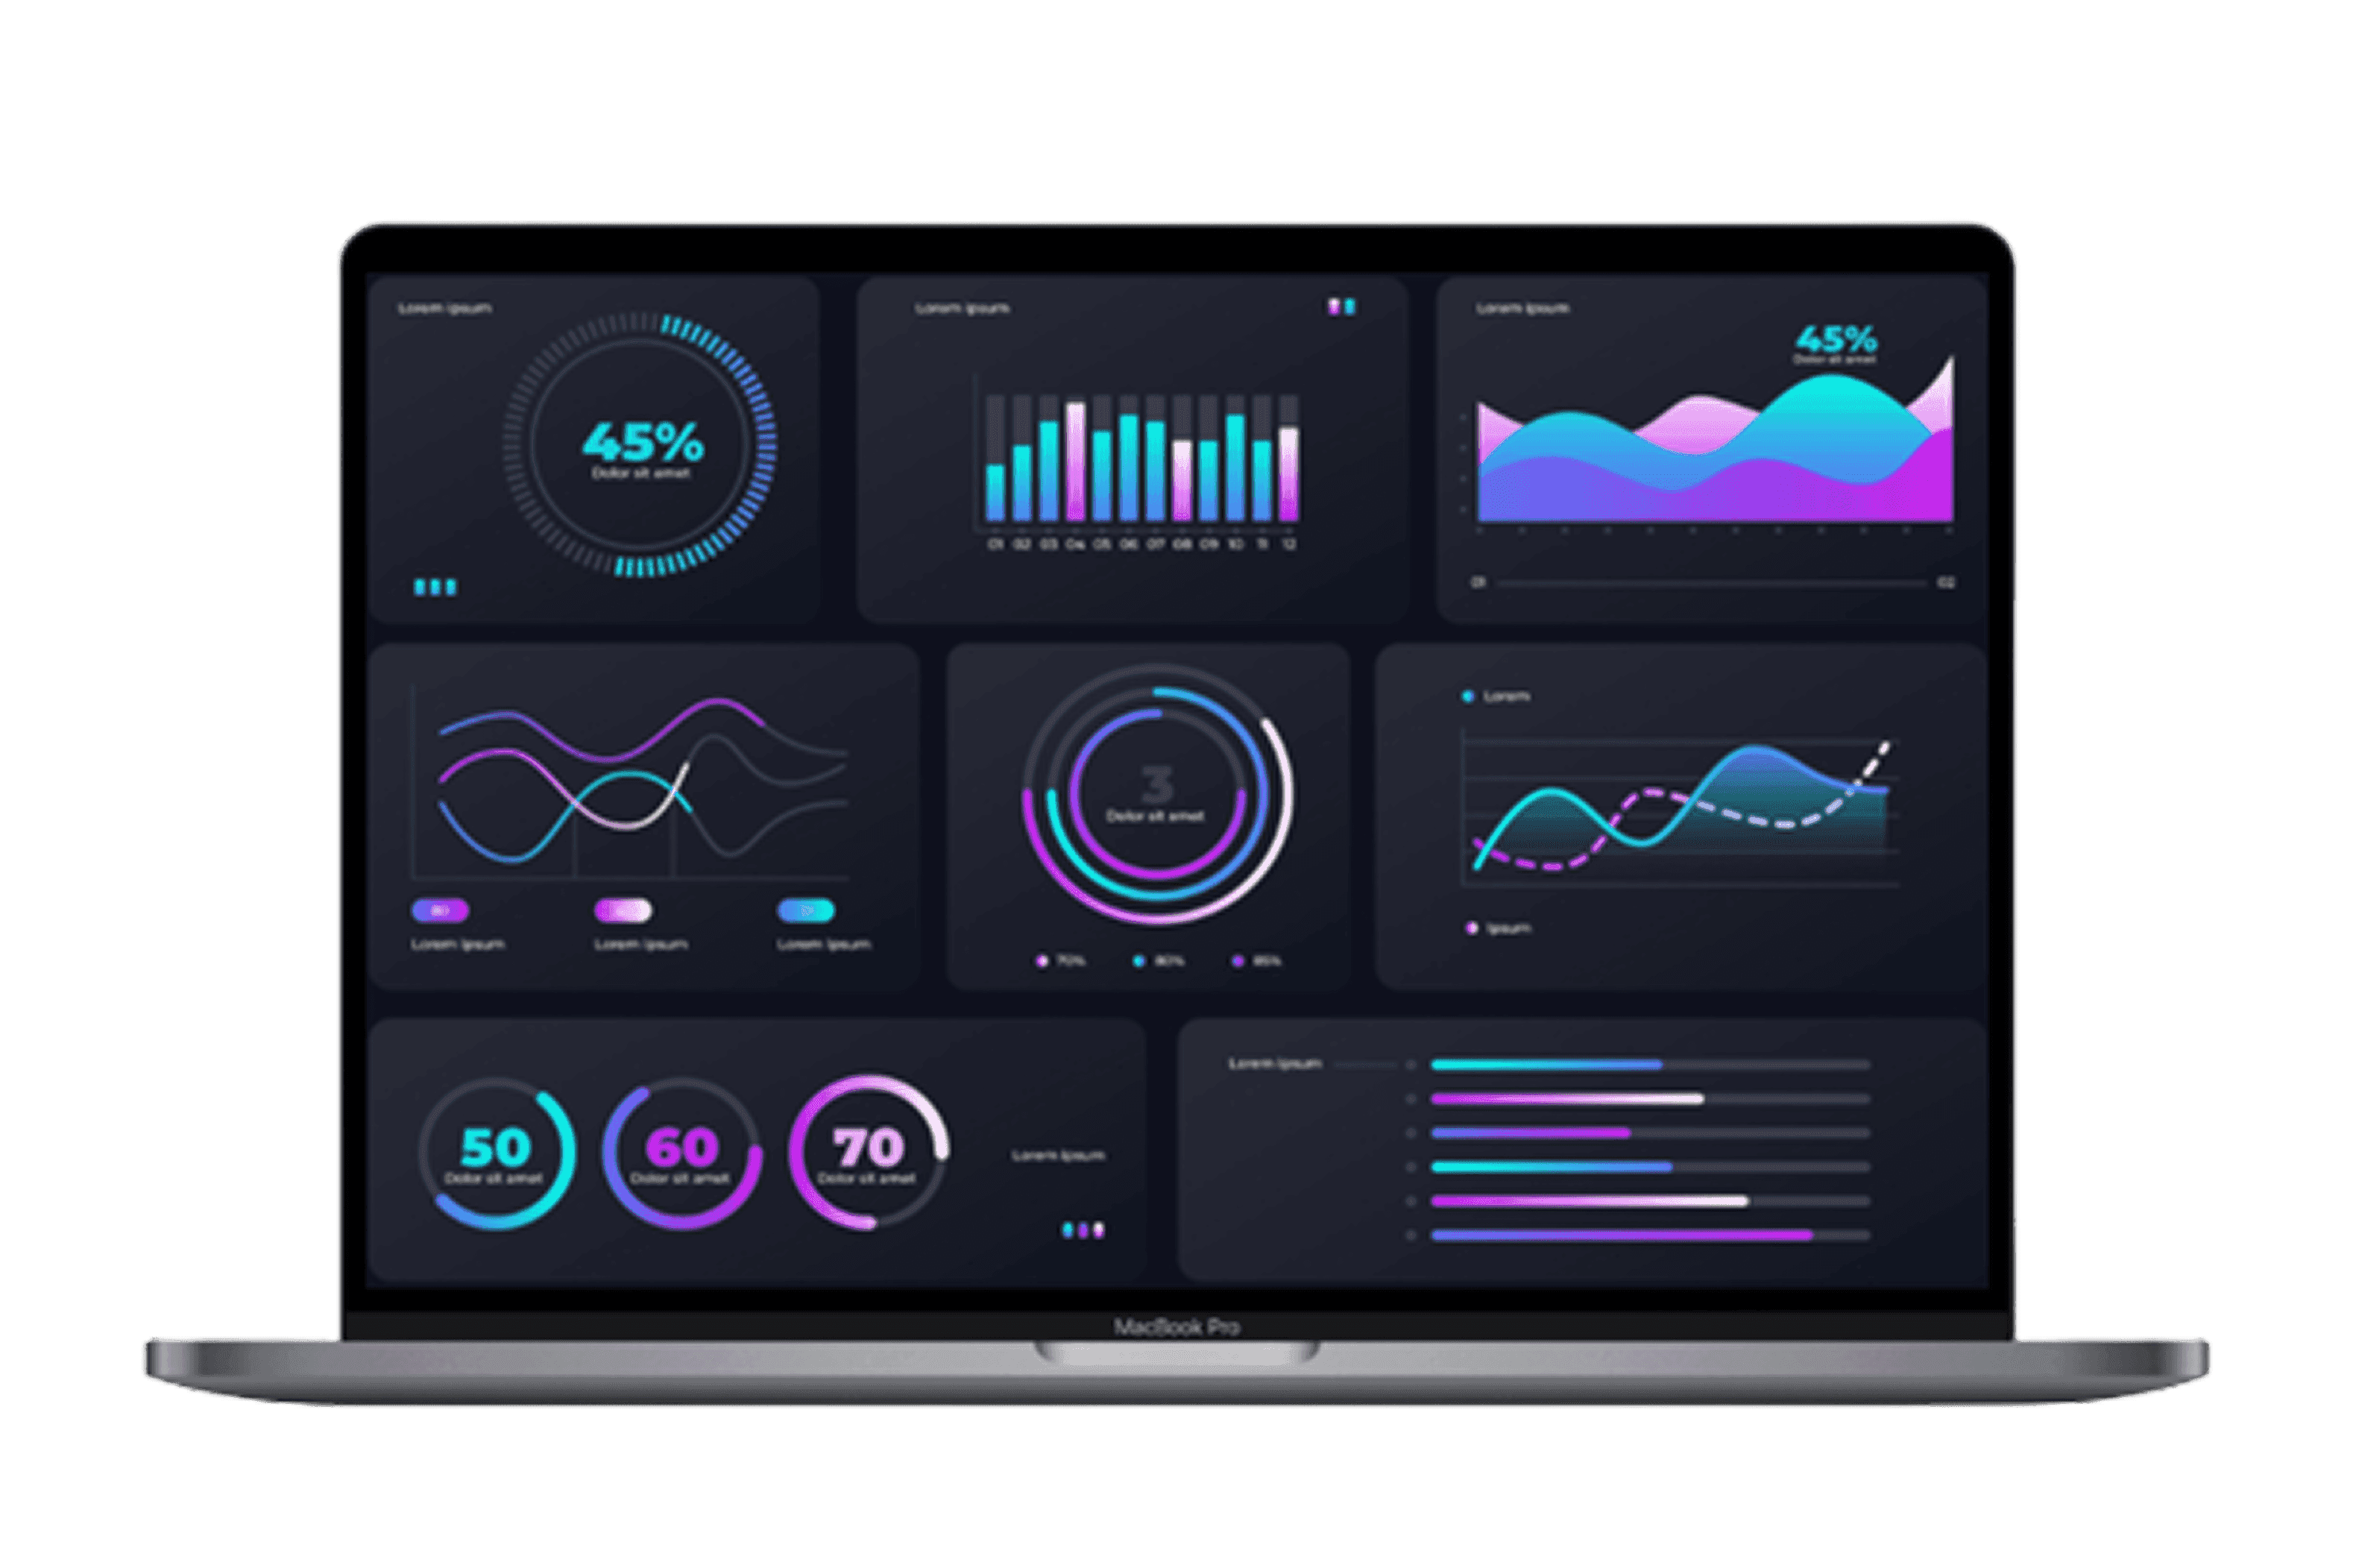
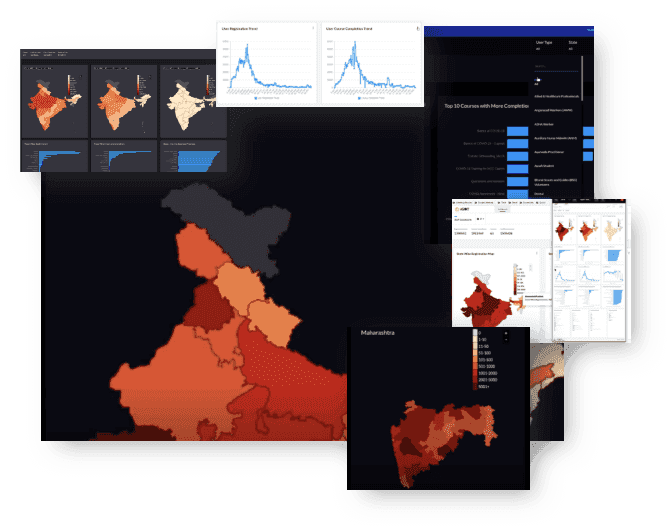
Design custom dashboards using a wide range of data visualizations for scalable implementations from simple bar charts to advanced map visualizations. Users can create multiple dashboards with diverse data collections.

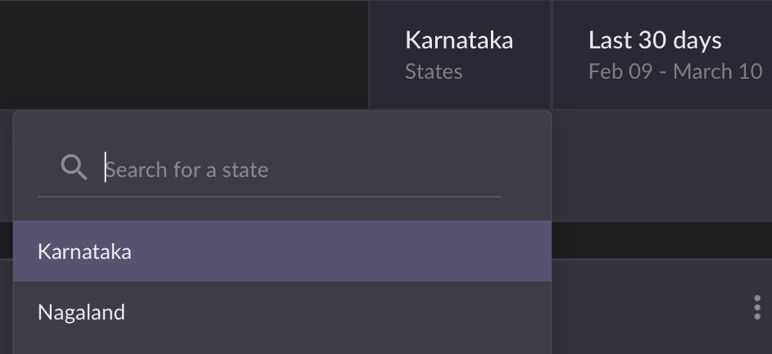
Leverage smart filters, time-based slicing, and drill-through tools for deep data insights. Enhance your analysis with the ability to dive into key performance metrics in real-time.

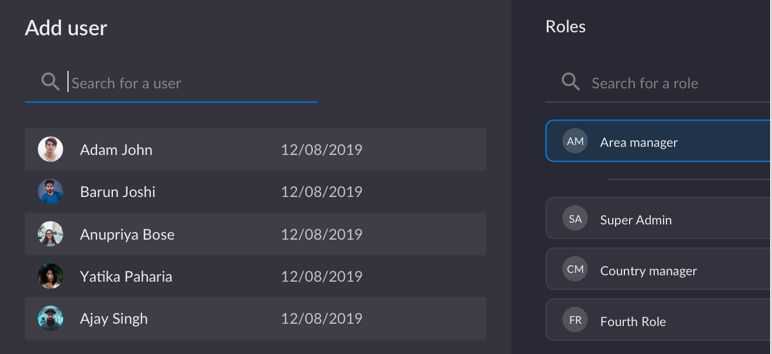
Control user roles, access levels, dashboard configurations, and reporting tools through a central admin console designed for optimal security and seamless governance.

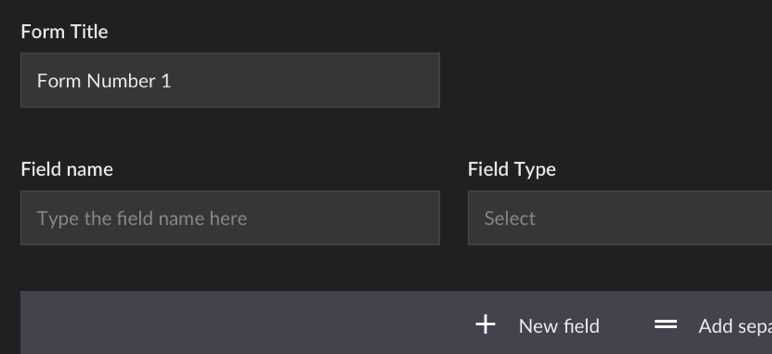
Design custom forms to collect various types of data, which can be seamlessly integrated with data pipelines for real-time visualizations.

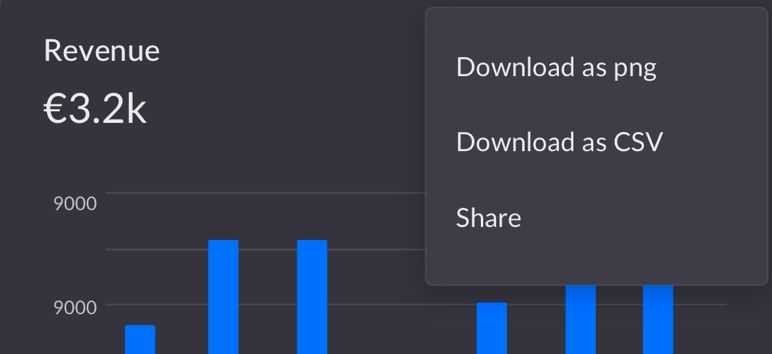
Generate detailed reports, download them in multiple formats, or share visualizations and reports effortlessly with stakeholders.

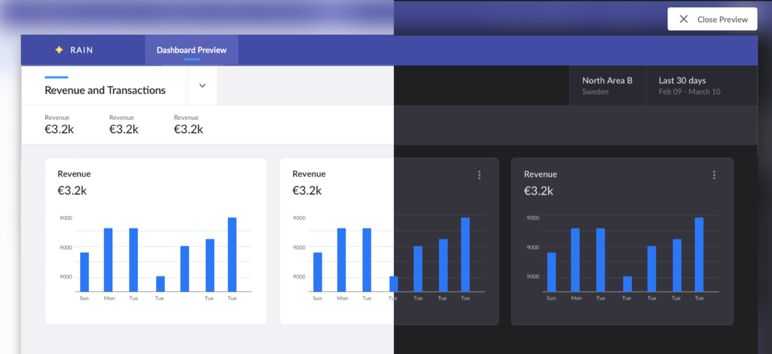
RAIN supports both dark and light themes with full customization, ensuring that your data analytics and insights platform aligns with your brand identity.


Visualisation support
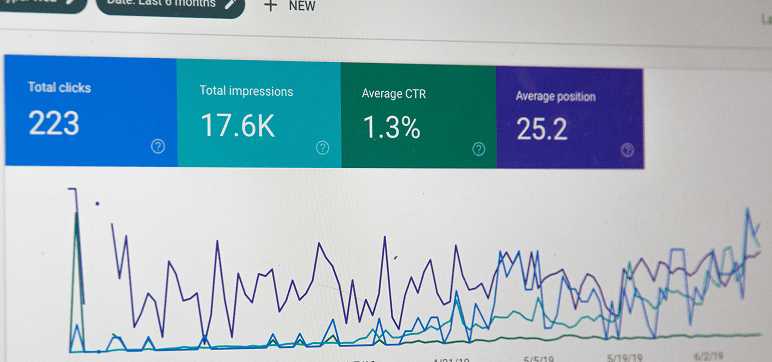
Access a wide range of data visualizations, from basic bar charts to advanced map visualizations, available right out of the box for quick insights.
Have unique data needs? RAIN provides tailored visual analytics for complex requirements in retail analytics, manufacturing analytics, or governance and so on.


Retail
Effortlessly monitor retail performance with our interactive dashboard cards on your website.
Explore

Worldcup
Track World Cup action live with our dynamic dashboard card, featuring real-time scores and match updates.
Explore

Healthcare
Monitor vital healthcare metrics with our interactive dashboard card, providing insights for informed decision-making.
ExploreImplementations


Want to unlock your true potential with intelligent data insights? Let’s partner to drive measurable business outcomes. Contact us and start your journey toward better business analytics today!
Explore More Accelerators
Proven platforms that can go country scale. Can be deployed in short notice and customised to fit needs of government agencies. Will fully in-house hosting, you have the total control of the data.

